
ZoomInfo Technologies, Inc. is a holding company, which engages in the provision of a cloud-based platform that offers information on organizations and professionals for sales and marketing teams. It offers sales leadership, sales development, marketing, and demand generation, sales and marketing operations, and recruiting.
Take a look at the 1-year chart of ZoomInfo (ZI) below with the added notations:
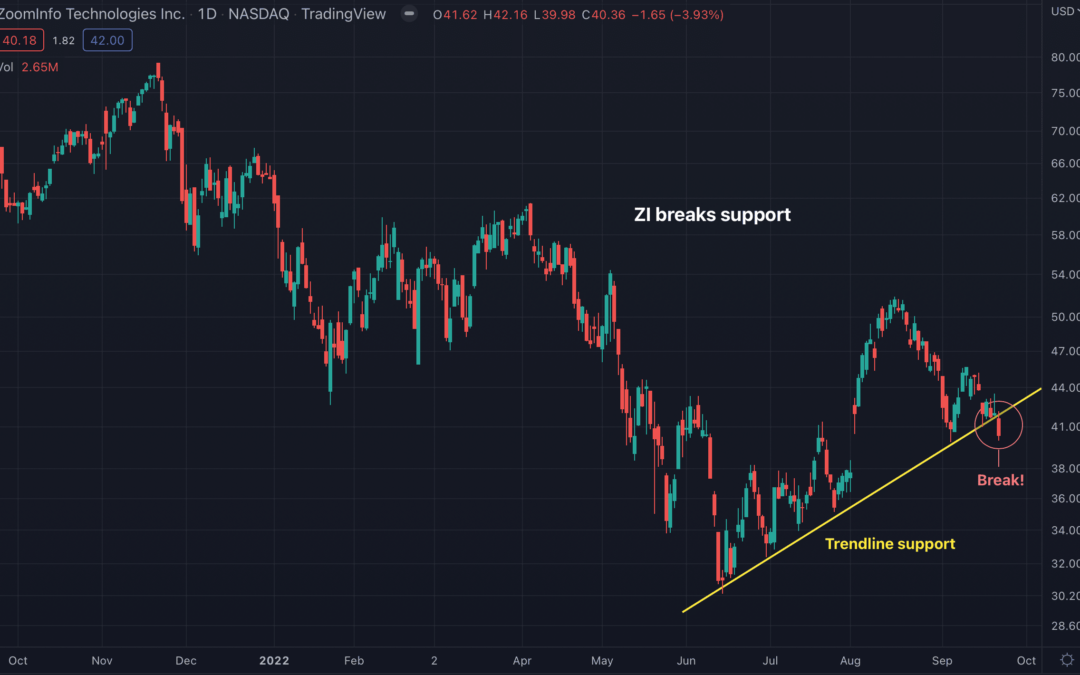
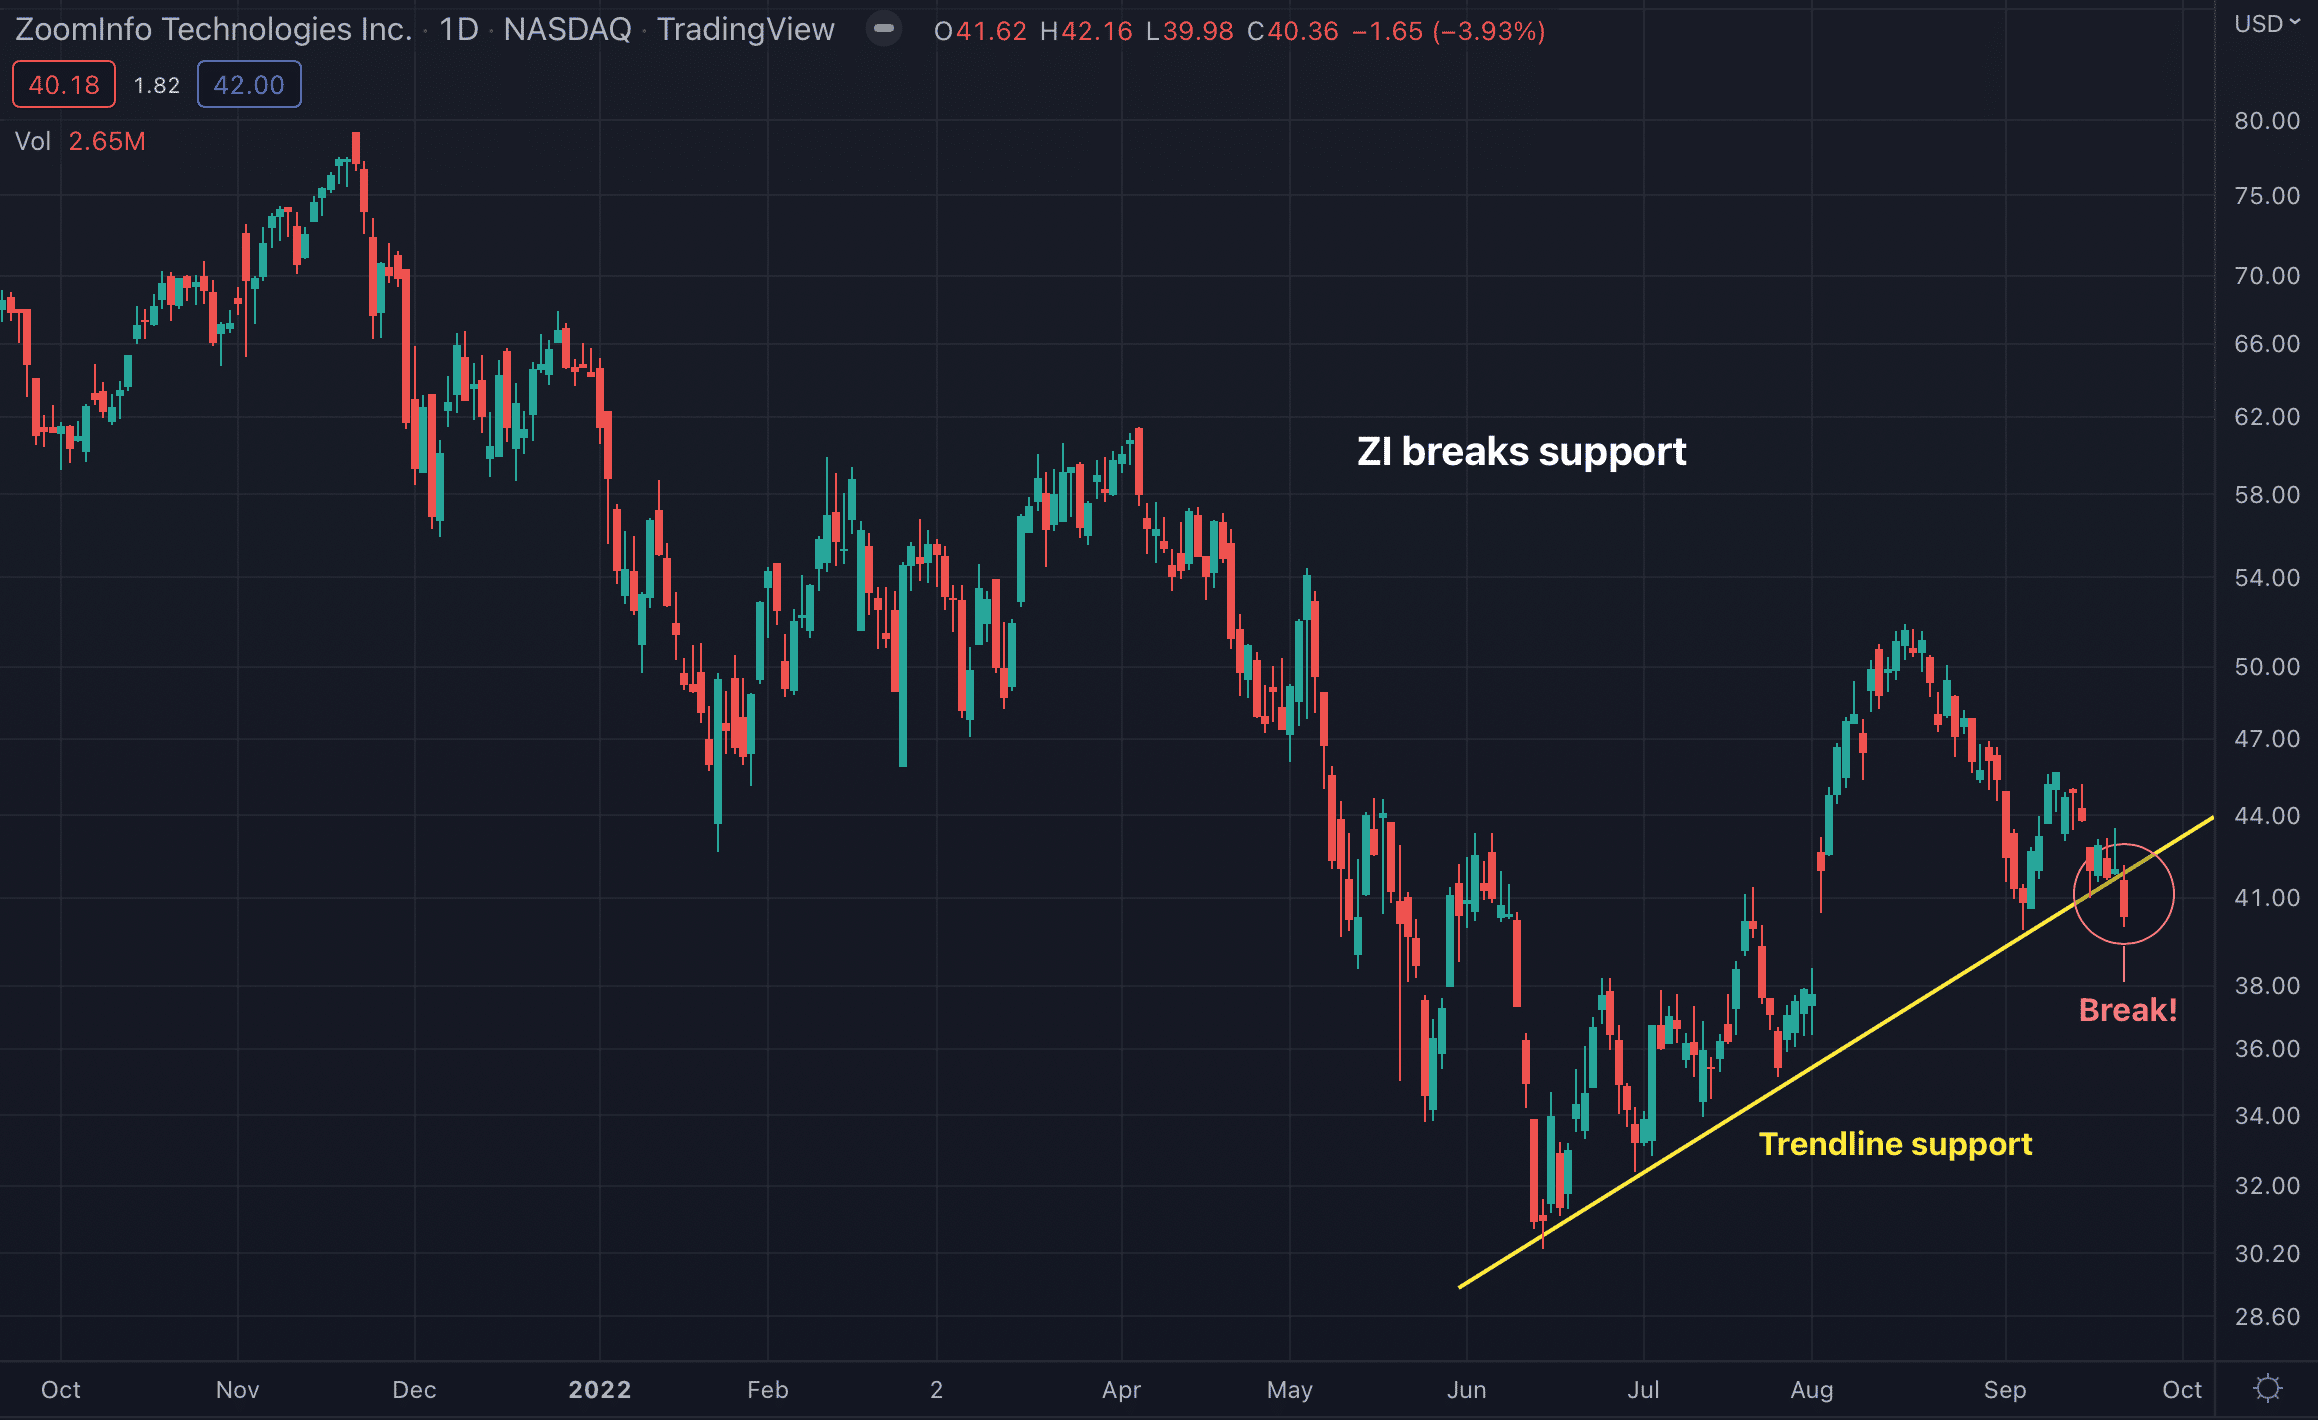 Chart of ZI provided by TradingView
Since putting in its June low, ZI has been rallying higher, while also creating a trendline of support (yellow). That line had been successfully tested several times up until yesterday when the support broke. Trendline breaks commonly lead to lower prices, overall.
The Tale of the Tape: ZI failed to hold its line of support. A short position could be entered near current prices, with a protective stop set above the price of entry.
Before making any trading decision, decide which side of the trade you believe gives you the highest probability of success. Do you prefer the short side of the market, long side, or do you want to be in the market at all? If you haven’t thought about it, review the overall indices themselves. For example, take a look at the S&P 500. Is it trending higher or lower? Has it recently broken through a key resistance or support level? Making these decisions ahead of time will help you decide which side of the trade you believe gives you the best opportunities.
No matter what your strategy or when you decide to enter, always remember to use protective stops and you’ll be around for the next trade. Capital preservation is always key…
Good luck!
Christian Tharp, CMT