
Schlumberger NV engages in the provision of technology for reservoir characterization, drilling, production and processing to the oil and gas industry. It operates through the following business segments: Digital and Integration, Reservoir Performance, Well Construction, and Production Systems.
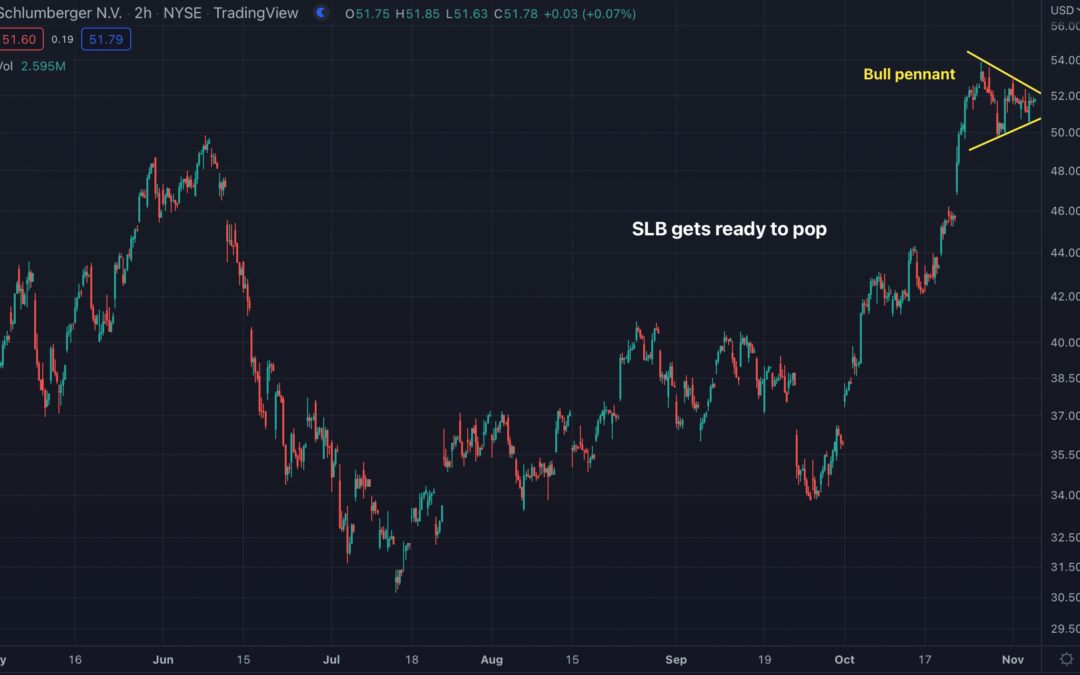
Take a look at the 6-month chart of Schlumberger (SLB) below with the added notations:
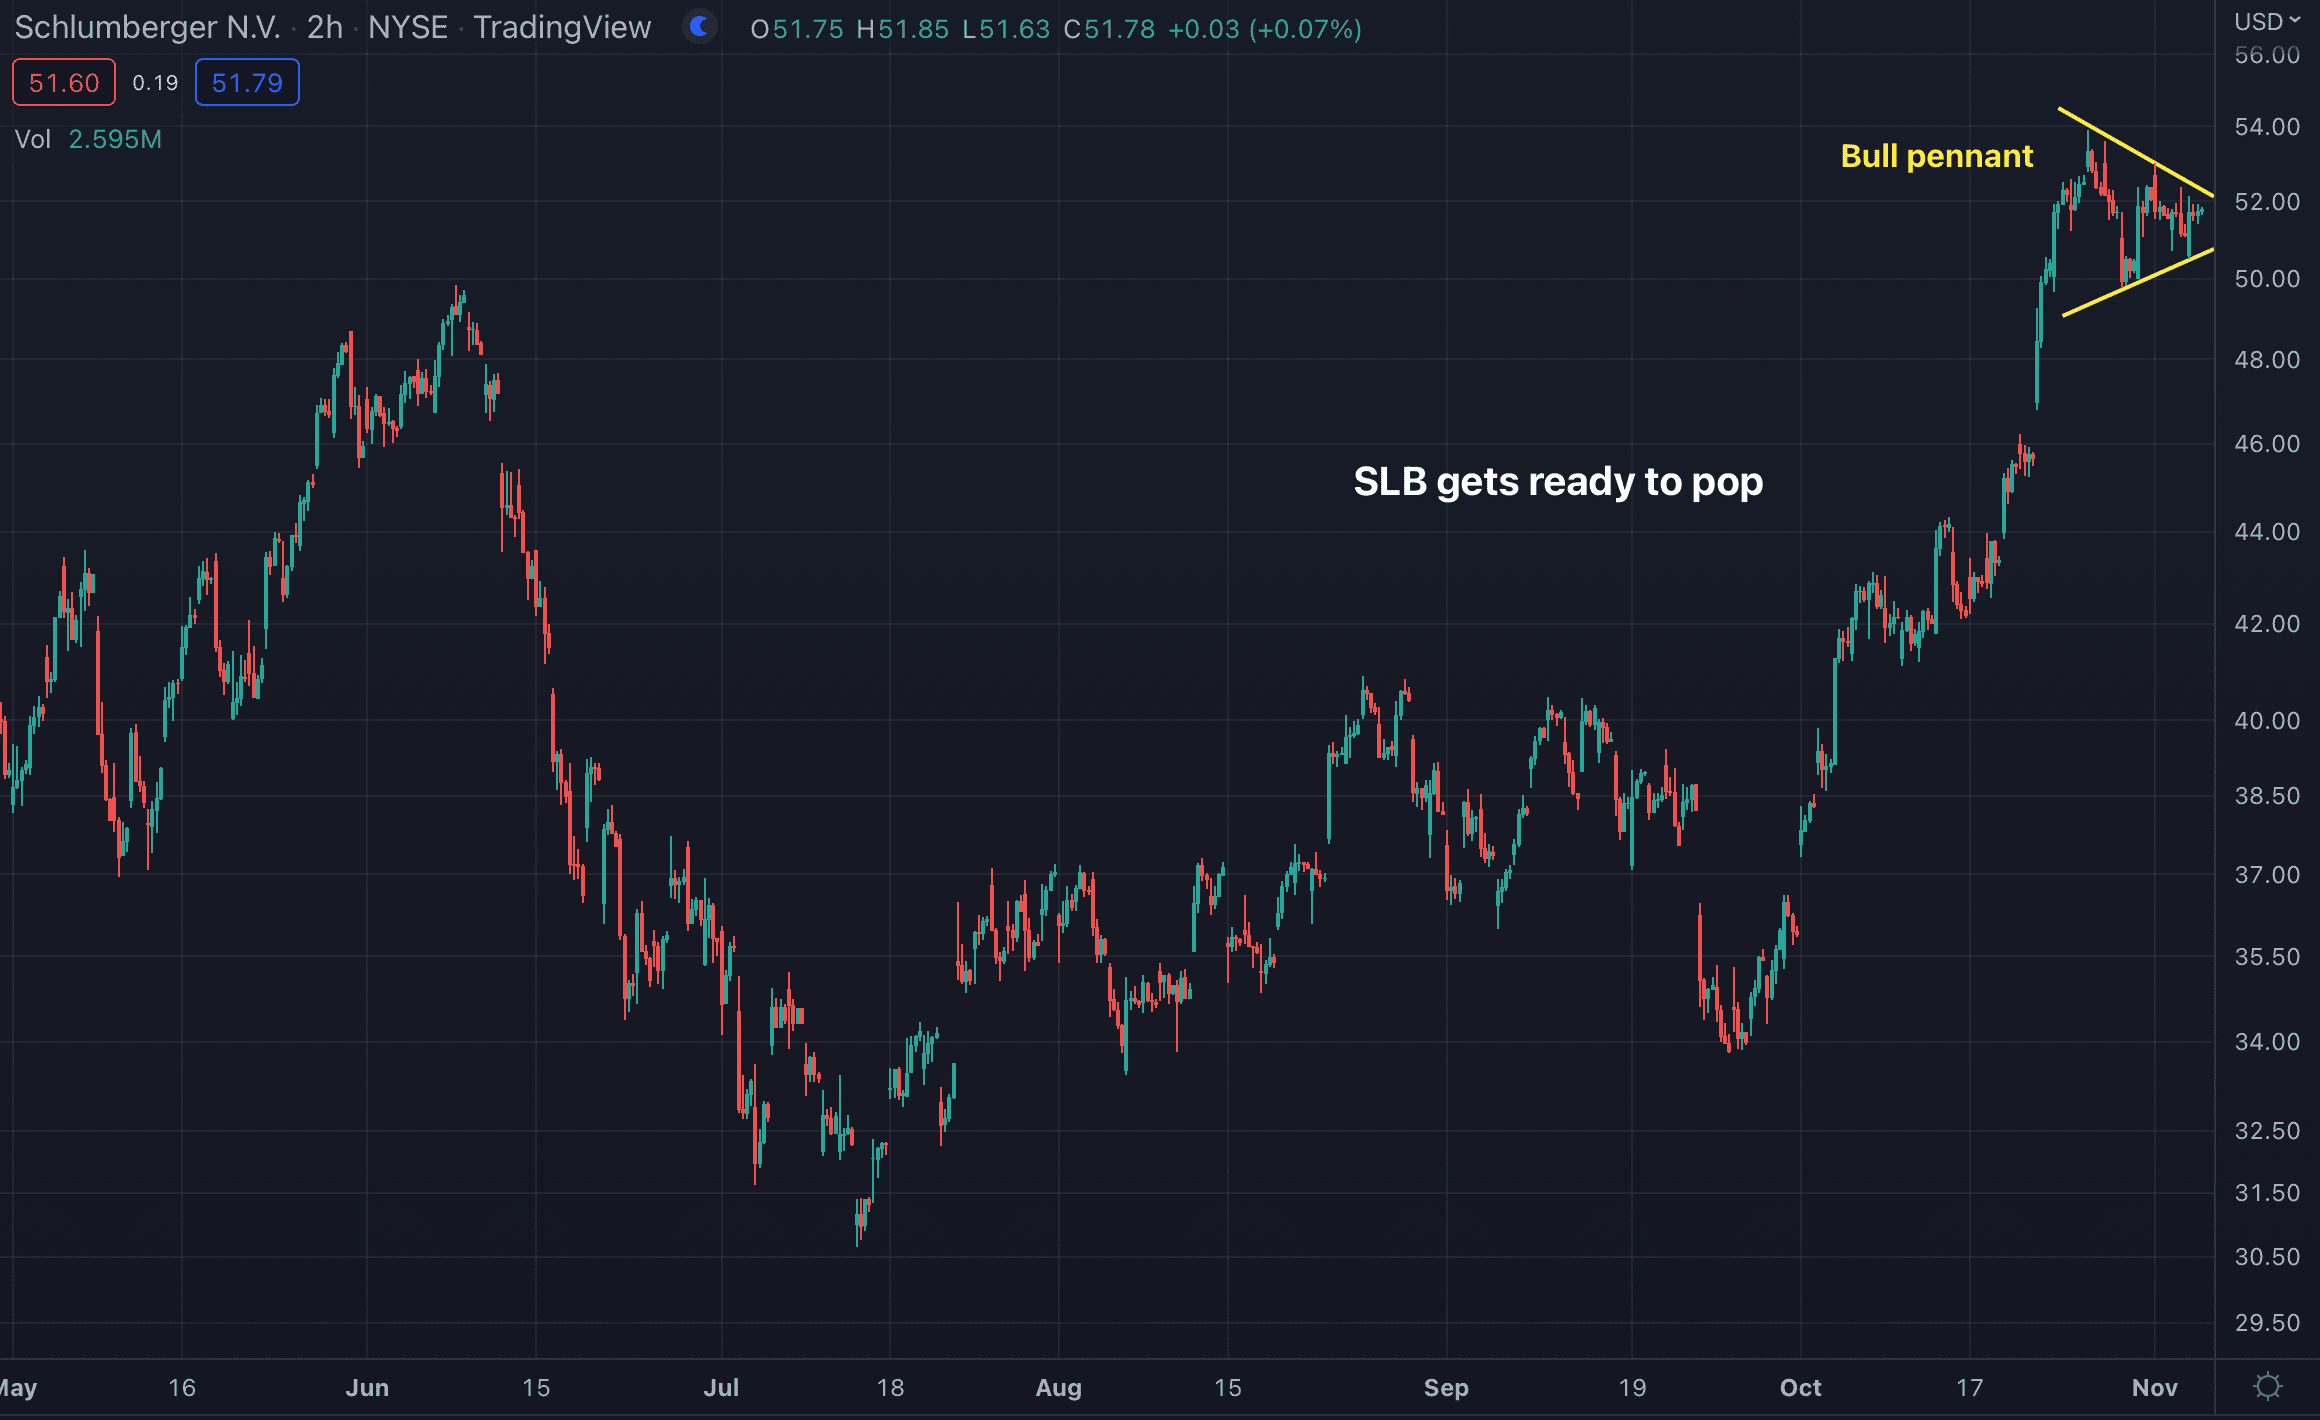
Chart of SLB provided by TradingView
SLB has been on a steep rally since the end of September and now seems to be consolidating within a bullish pennant pattern (yellow). The pennant’s trendline resistance and support can be seen on the chart above. A break through the topside of the pennant should mean a run to new highs.
The Tale of the Tape: SLB is consolidating within a pennant pattern. A break above $52 area should lead to higher prices, thus a long trade could be made.
Before making any trading decision, decide which side of the trade you believe gives you the highest probability of success. Do you prefer the short side of the market, long side, or do you want to be in the market at all? If you haven’t thought about it, review the overall indices themselves. For example, take a look at the S&P 500. Is it trending higher or lower? Has it recently broken through a key resistance or support level? Making these decisions ahead of time will help you decide which side of the trade you believe gives you the best opportunities.
No matter what your strategy or when you decide to enter, always remember to use protective stops and you’ll be around for the next trade. Capital preservation is always key…
Good luck!
Christian Tharp, CMT