
Organogenesis Holdings, Inc. is a regenerative medical company. It focuses on the development, manufacture and commercialization of product solutions for the advanced wound care, surgical and sports medicine markets.
Take a look at the 1-year chart of Organogenesis (NASDAQ: ORGO) below with the added notations…

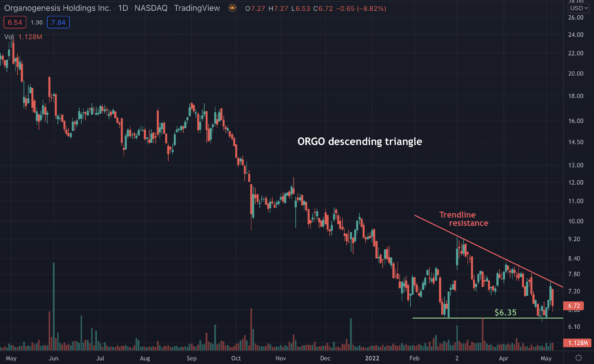
Chart of ORGO provided by TradingView
ORGO has formed key support at around $6.35 (green) over the past few months. In addition, the stock is declining against a down trending resistance line (red). These two lines has ORGO trading within a price pattern known as a descending triangle. Eventually, the stock will have to break out of it.
The Tale of the Tape: ORGO has formed a triangle pattern. A short trade could be made on a break of triangle support, while a long trade could be made if the stock were to break above trendline resistance. Either way, protective stops should be used.
Before making any trading decision, decide which side of the trade you believe gives you the highest probability of success. Do you prefer the short side of the market, long side, or do you want to be in the market at all? If you haven’t thought about it, review the overall indices themselves. For example, take a look at the S&P 500. Is it trending higher or lower? Has it recently broken through a key resistance or support level? Making these decisions ahead of time will help you decide which side of the trade you believe gives you the best opportunities.
No matter what your strategy or when you decide to enter, always remember to use protective stops and you’ll be around for the next trade. Capital preservation is always key!
Good luck!
Christian Tharp, CMT
ATTENTION SUBSCRIBERS!
Do not trade options until you watch my urgent message:
Learn how to use this simple, yet extremely powerful options strategy