
Janus Henderson Group Plc is a holding company, which engages in the provision of asset management services. It offers investment solutions including equities, quantitative equities, fixed income, multi-asset and alternative asset class strategies.
Take a look at the 1-year chart of Janus (NYSE: JHG) below with the added notations…
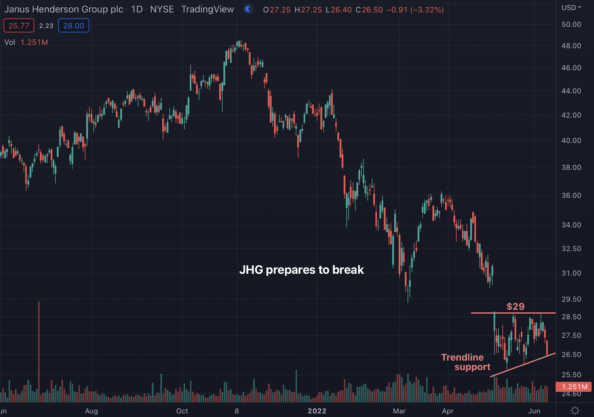
Chart of JHG provided by TradingView
JHG has formed key resistance at around $29 (red) over the past several weeks. In addition, the stock is also rising on top of an up-trending support line. These two lines have JHG trading within a common pattern known as an ascending triangle. Eventually, the stock will break out of it.
The Tale of the Tape: JHG has formed a triangle pattern. A short trade could be made on a break of support or on a test of resistance. A long trade could be made at support or on a break through the triangle resistance.
Before making any trading decision, decide which side of the trade you believe gives you the highest probability of success. Do you prefer the short side of the market, long side, or do you want to be in the market at all? If you haven’t thought about it, review the overall indices themselves. For example, take a look at the S&P 500. Is it trending higher or lower? Has it recently broken through a key resistance or support level? Making these decisions ahead of time will help you decide which side of the trade you believe gives you the best opportunities.
No matter what your strategy or when you decide to enter, always remember to use protective stops and you’ll be around for the next trade. Capital preservation is always key!
Good luck!
Christian Tharp, CMT
ATTENTION SUBSCRIBERS!
Do not trade options until you watch my urgent message and learn my: