
Meta Platforms, Inc., engages in the development of social media applications. It builds technology that helps people connect, find communities, and grow businesses. It operates through the Family of Apps (FoA) and Reality Labs (RL) segments.
Take a look at the 3-month chart of Meta (NASDAQ: META) below with the added notations…

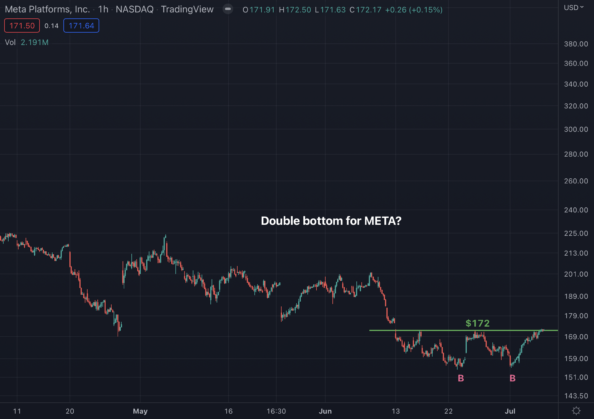
Chart of META provided by TradingView
META has been on the decline for quite a while, like many stocks, but it may now be forming a double bottom price pattern. As with any price pattern, a confirmation of the pattern is needed, and META would confirm the double pattern on a break above the $172 resistance level.
The Tale of the Tape: META may be forming a double bottom price pattern. A long trade could be entered on a break above the $172 level with a stop placed under that price of entry.
Before making any trading decision, decide which side of the trade you believe gives you the highest probability of success. Do you prefer the short side of the market, long side, or do you want to be in the market at all? If you haven’t thought about it, review the overall indices themselves. For example, take a look at the S&P 500. Is it trending higher or lower? Has it recently broken through a key resistance or support level? Making these decisions ahead of time will help you decide which side of the trade you believe gives you the best opportunities.
No matter what your strategy or when you decide to enter, always remember to use protective stops and you’ll be around for the next trade. Capital preservation is always key!
Good luck!
Christian Tharp, CMT
ATTENTION SUBSCRIBERS!
Do not trade options until you watch my urgent message: