

W.R. Berkley Corp. is an insurance holding company, which engages in the property casualty insurance business. It operates through the following segments: Insurance and Reinsurance & Monoline Excess.
Take a look at the 1-year chart of Berkley (NYSE: WRB) below with the added notations…
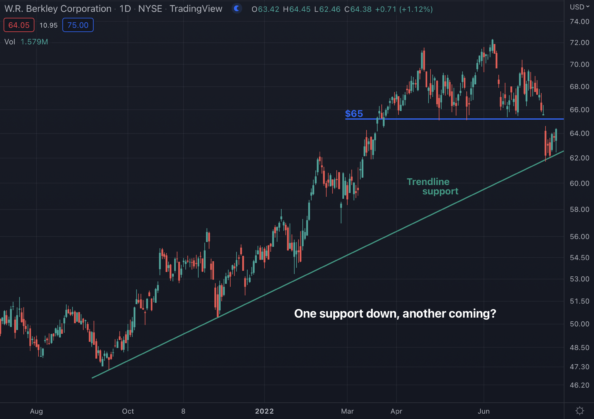
Chart of WRB provided by TradingView
Having weathered most of the current bear market better than most, WRB finally broke its major level of support at $65 (blue). That break immediately took the stock down to an important trendline of support. At some point, WRB will either break trendline support, or break back above the $65 level.
The Tale of the Tape: WRB is stuck between trend line support and $65 resistance. A long position could be entered on a pullback to the trendline, or a break back above $65, with a stop placed below the level of entry. A short position could be considered if WRB were to break below its trendline or rally up to $65.
Before making any trading decision, decide which side of the trade you believe gives you the highest probability of success. Do you prefer the short side of the market, long side, or do you want to be in the market at all? If you haven’t thought about it, review the overall indices themselves. For example, take a look at the S&P 500. Is it trending higher or lower? Has it recently broken through a key resistance or support level? Making these decisions ahead of time will help you decide which side of the trade you believe gives you the best opportunities.
No matter what your strategy or when you decide to enter, always remember to use protective stops and you’ll be around for the next trade. Capital preservation is always key!
Good luck!
Christian Tharp, CMT
ATTENTION SUBSCRIBERS!
Do not trade options until you watch my urgent message:
Learn how to use this simple, yet extremely powerful options strategy