
Anavex Life Sciences Corp. is a clinical stage biopharmaceutical company, which engages in the development of different therapeutics for the treatment of neurodegenerative and neurodevelopmental diseases.
Take a look at the 1-year chart of Anavex (NASDAQ: AVXL) below with the added notations:
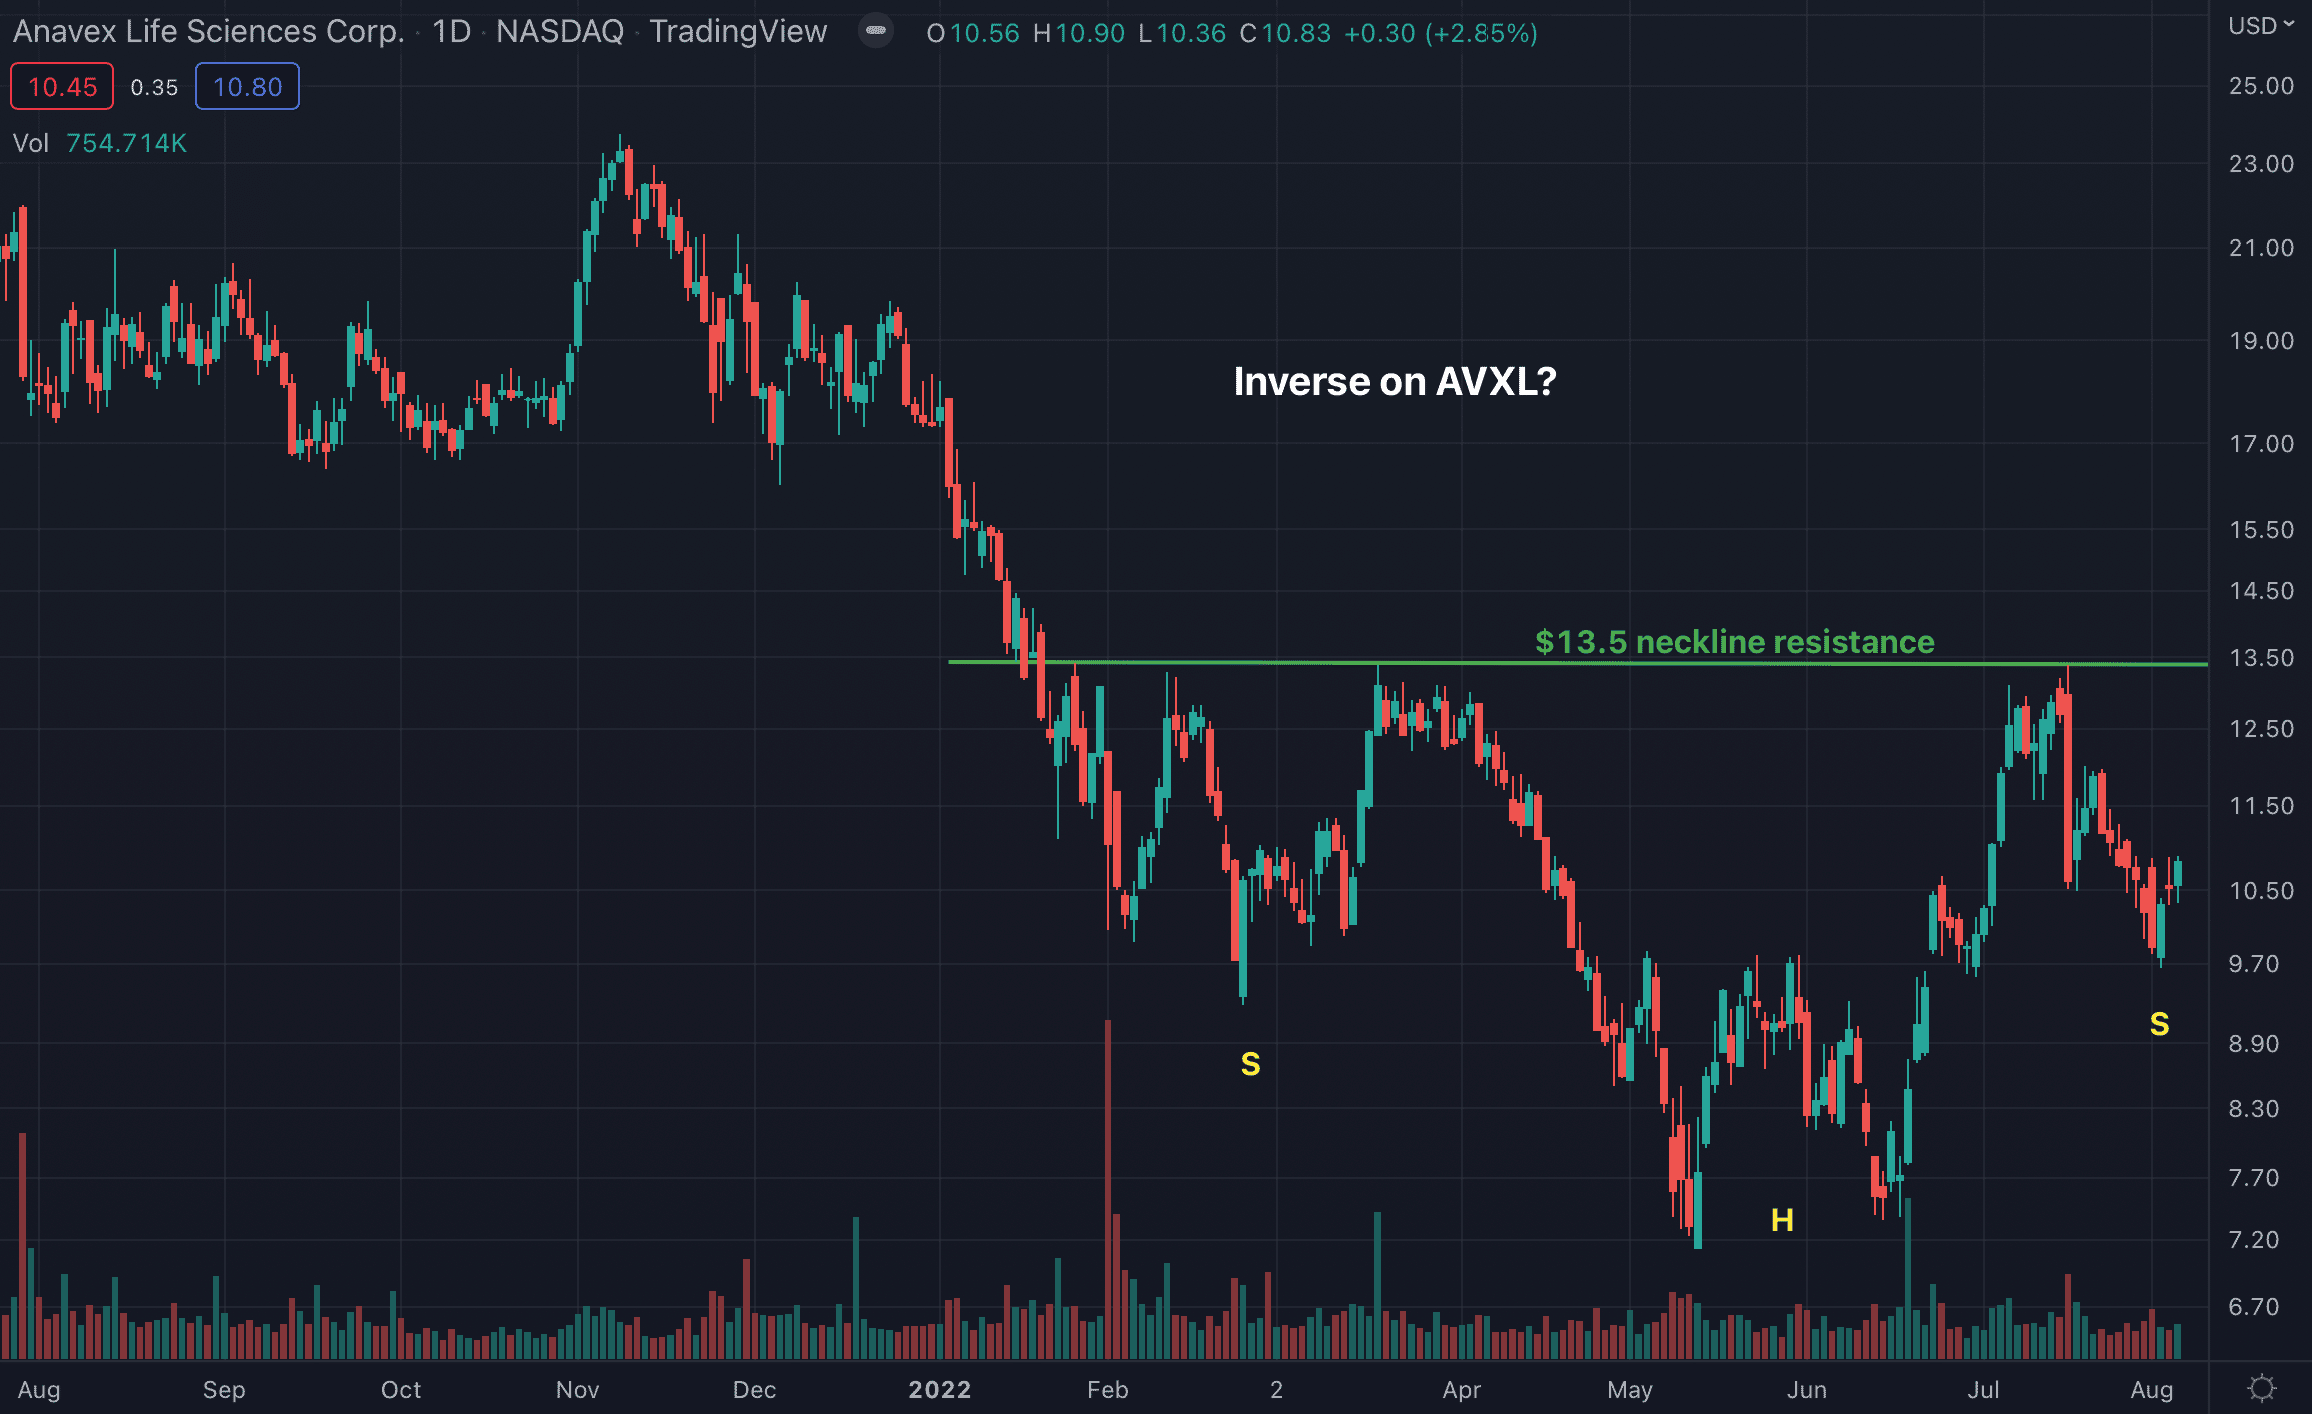
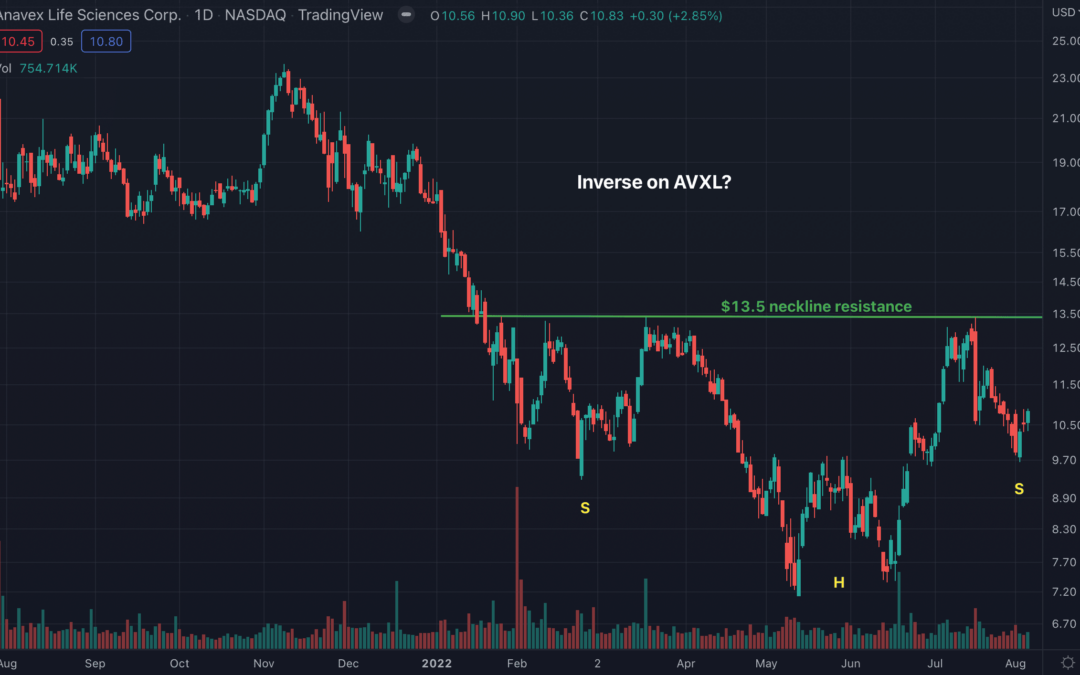
Chart of AVXL provided by TradingView
Over the past several months, AVXL seems to be forming an inverse head and shoulders reversal pattern. The head (H) and the shoulders (S) have been noted to make the pattern more visible. The stock’s neckline resistance is currently sitting around $13.5 (green). AVXL would confirm its H&S by breaking through the neckline.
The Tale of the Tape: AVXL may be forming an inverse head & shoulders pattern. A long trade could be entered on a break through the $13.5 neckline.
Before making any trading decision, decide which side of the trade you believe gives you the highest probability of success. Do you prefer the short side of the market, long side, or do you want to be in the market at all? If you haven’t thought about it, review the overall indices themselves. For example, take a look at the S&P 500. Is it trending higher or lower? Has it recently broken through a key resistance or support level? Making these decisions ahead of time will help you decide which side of the trade you believe gives you the best opportunities.
No matter what your strategy or when you decide to enter, always remember to use protective stops and you’ll be around for the next trade. Capital preservation is always key!
Good luck!
Christian Tharp, CMT
ATTENTION SUBSCRIBERS!
Do not trade options until you watch my urgent message: