
Xylem, Inc. engages in the design, manufacture, and application of engineered technologies for the water industry. It operates through the following business segments: Water Infrastructure, Applied Water, and Measurement and Control Solutions.
Take a look at the 1-year chart of Xylem (NYSE: XLY) below with the added notations:
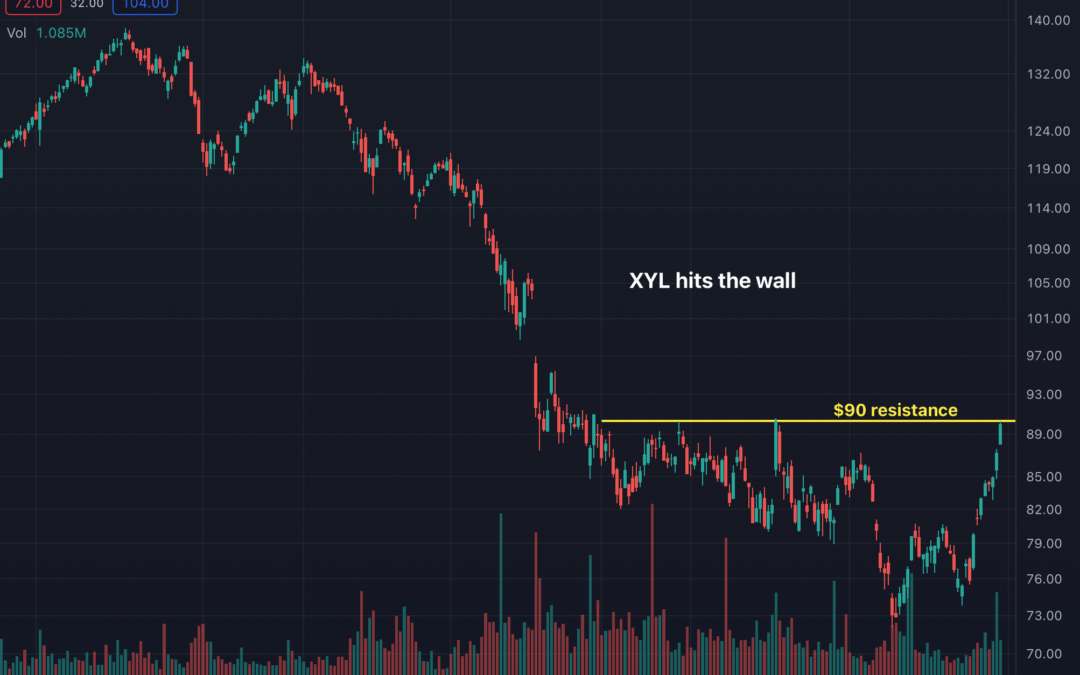
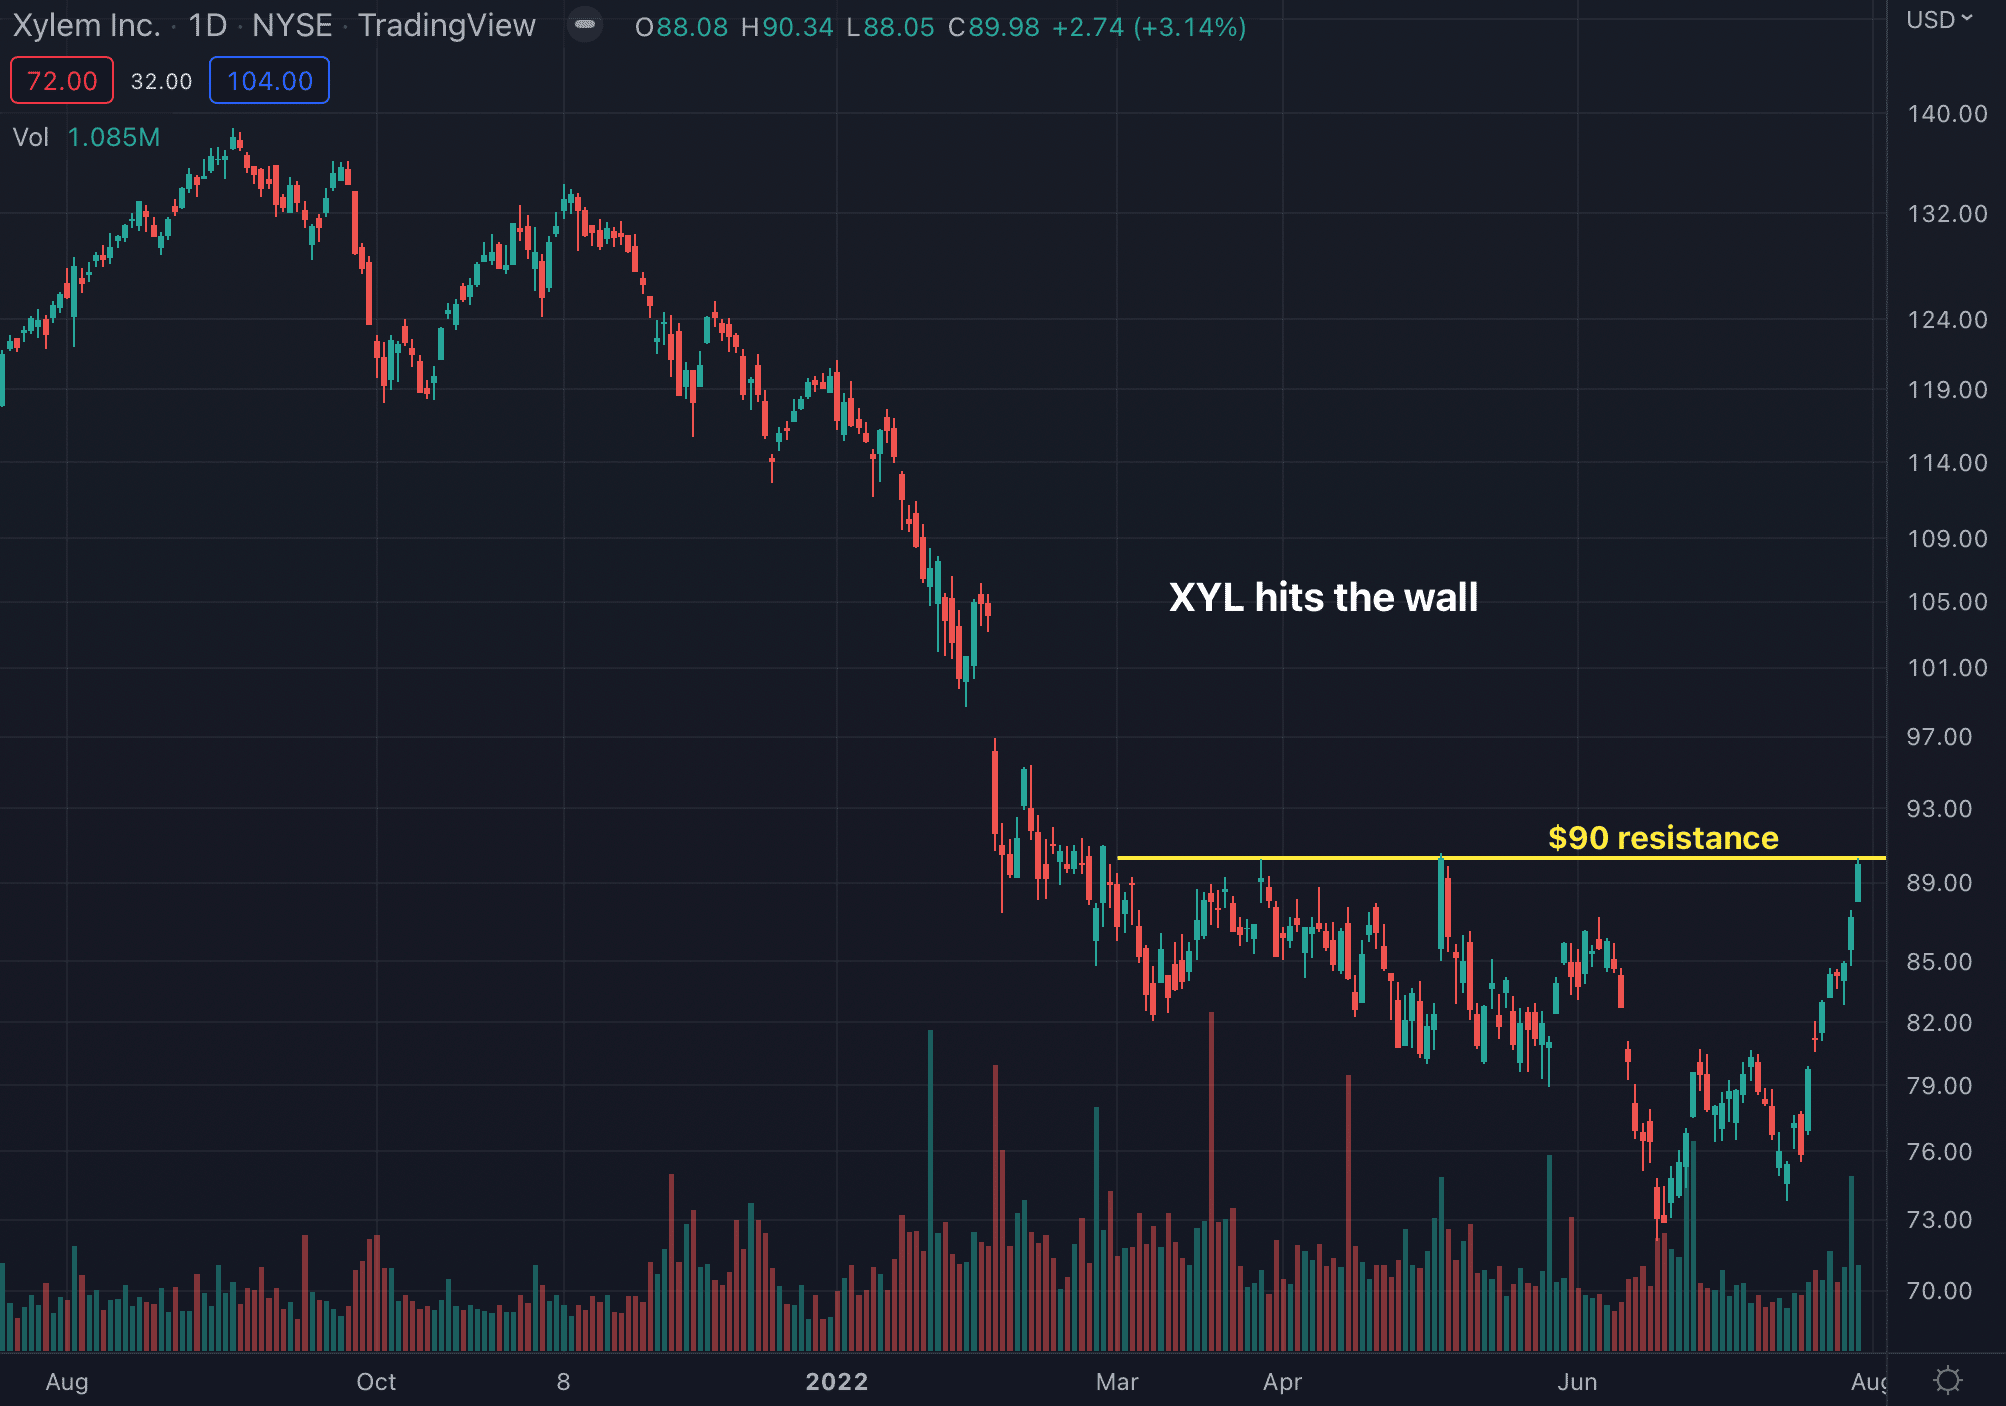 Chart of XYL provided by TradingView
XYL has stalled at the $90 resistance (yellow) on multiple occasions since spring of this year, the most recent instance being just a few days ago. If the stock can manage to break up through that $63 zone, higher prices should be on the way.
The Tale of the Tape: XYL has an important area of resistance around $90. A long trade could be entered on a break through that level, with a stop placed below it. However, if you are bearish on the stock, a short trade could be made on any rallies up to the $90 area.
Before making any trading decision, decide which side of the trade you believe gives you the highest probability of success. Do you prefer the short side of the market, long side, or do you want to be in the market at all? If you haven’t thought about it, review the overall indices themselves. For example, take a look at the S&P 500. Is it trending higher or lower? Has it recently broken through a key resistance or support level? Making these decisions ahead of time will help you decide which side of the trade you believe gives you the best opportunities.
No matter what your strategy or when you decide to enter, always remember to use protective stops and you’ll be around for the next trade. Capital preservation is always key!
Good luck!
Christian Tharp, CMT
ATTENTION SUBSCRIBERS!
Do not trade options until you watch my urgent message:
Learn how to use this simple, yet extremely powerful options strategy