

Laredo Petroleum, Inc. engages in the exploration, development and acquisition of oil and natural gas properties. It operates in the Permian Basin in West Texas. The company was founded by Randy A. Foutch in October 2006 and is headquartered in Tulsa, OK.
Take a look at the 1-year chart of Laredo (NYSE: LPI) below with the added notations…
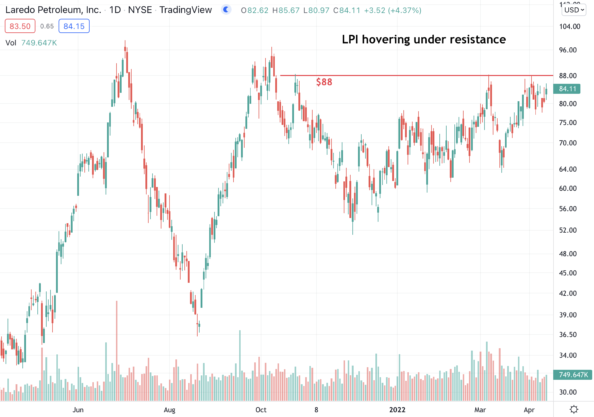
Chart of LPI provided by TradingView
LPI has hit the $88 level as resistance (red) on multiple occasions since late last year. The stock appears to be making a run back to the mark again. A break above $88 should lead to higher prices for LPI, likely a run back to the $96 highs.
The Tale of the Tape: LPI has an important level of resistance around $88. A long trade could be entered on a breakthrough of that level, with a stop placed below it. However, if you are bearish on the stock, a short trade could be made on any rallies up to the $88 area.
Before making any trading decision, decide which side of the trade you believe gives you the highest probability of success. Do you prefer the short side of the market, long side, or do you want to be in the market at all? If you haven’t thought about it, review the overall indices themselves. For example, take a look at the S&P 500. Is it trending higher or lower? Has it recently broken through a key resistance or support level? Making these decisions ahead of time will help you decide which side of the trade you believe gives you the best opportunities.
No matter what your strategy or when you decide to enter, always remember to use protective stops and you’ll be around for the next trade. Capital preservation is always key!
Good luck!
Christian Tharp, CMT
ATTENTION SUBSCRIBERS!
Do not trade options until you watch my urgent message: