
Starbucks Corp. engages in the production, marketing, and retailing of specialty coffee. It operates through the following segments: North America, International, and Channel Development.
Take a look at the 1-year chart of Starbucks (SBUX) below with the added notations:
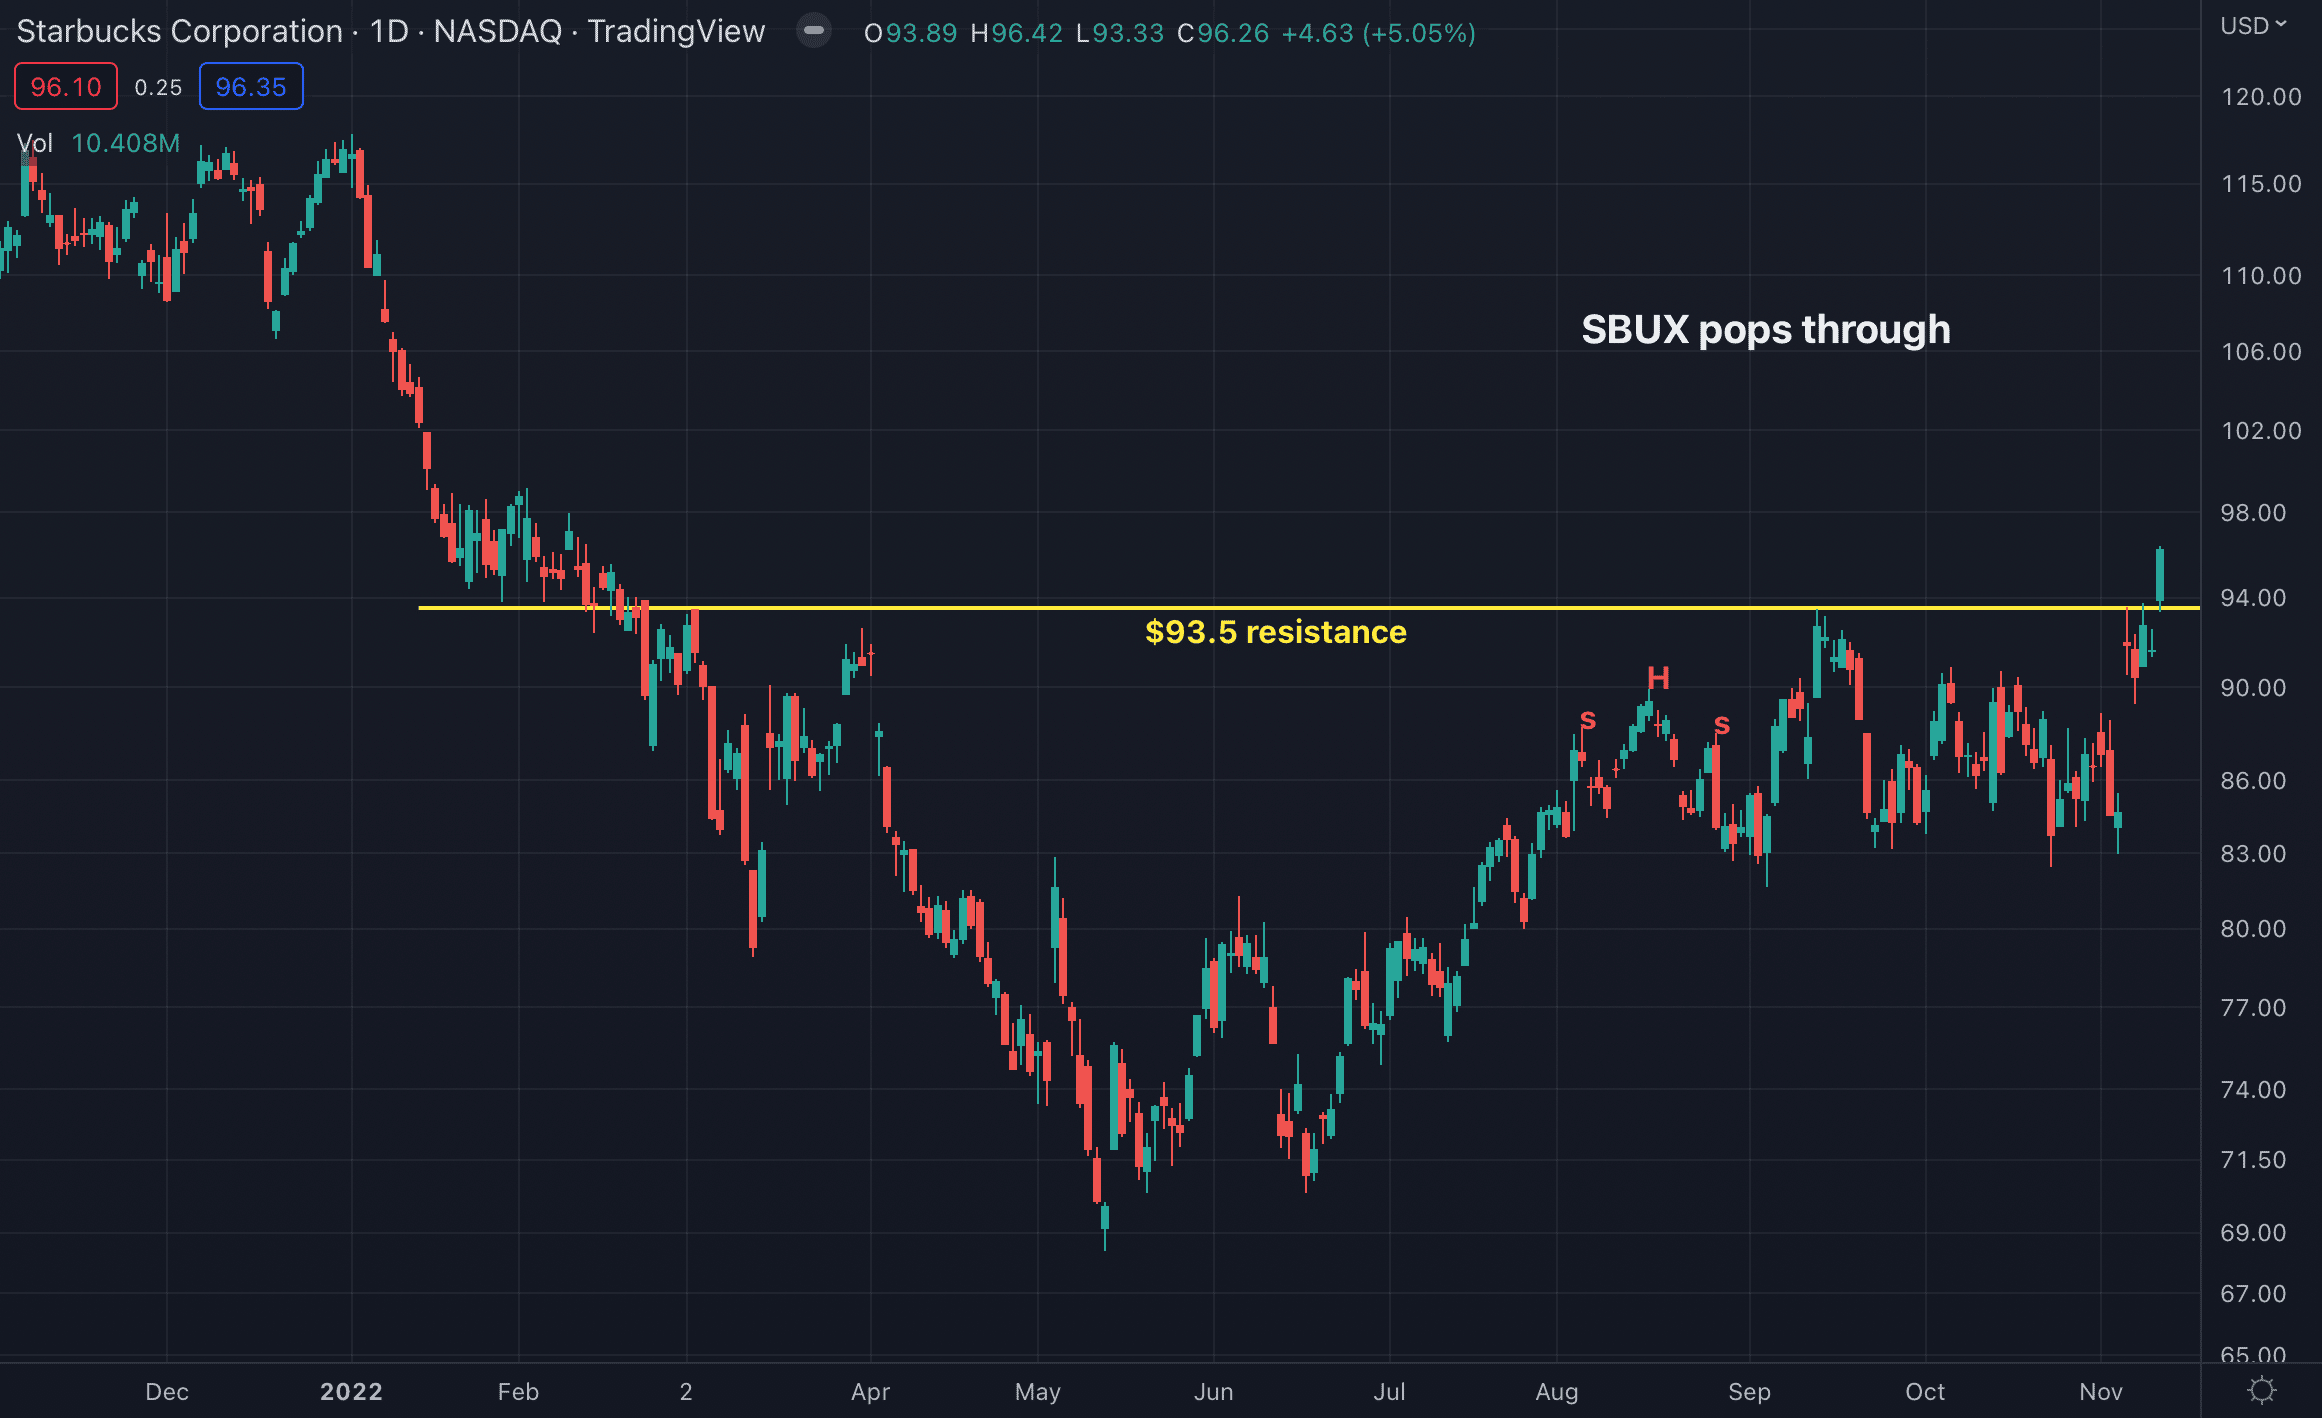
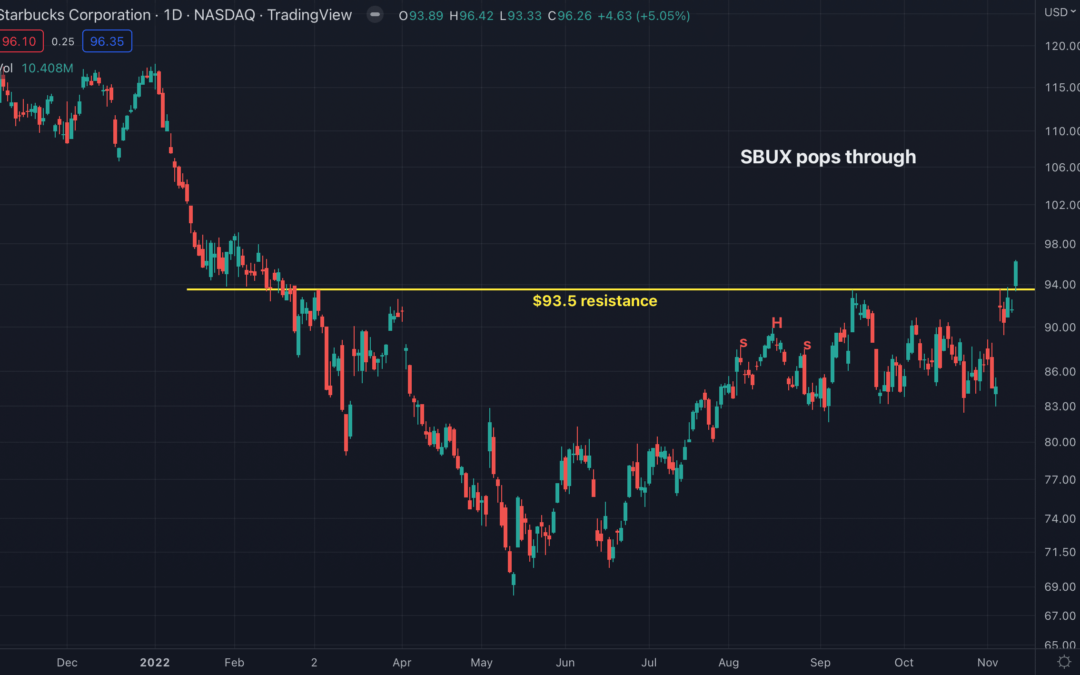
Chart of SBUX provided by TradingView
SBUX had formed an important level of resistance at the $93.5 (yellow) mark during the course of the past 9 months. The stock tested that level multiple times this year and finally broke above it yesterday. That breakout should lead to another leg higher for SBUX.
The Tale of the Tape: SBUX broke through a key level of resistance at $93.5. A long trade could be entered now, or on a pullback down to the $93.5 area, with a protective stop set below the level of entry.
Before making any trading decision, decide which side of the trade you believe gives you the highest probability of success. Do you prefer the short side of the market, long side, or do you want to be in the market at all? If you haven’t thought about it, review the overall indices themselves. For example, take a look at the S&P 500. Is it trending higher or lower? Has it recently broken through a key resistance or support level? Making these decisions ahead of time will help you decide which side of the trade you believe gives you the best opportunities.
No matter what your strategy or when you decide to enter, always remember to use protective stops and you’ll be around for the next trade. Capital preservation is always key…
Good luck!
Christian Tharp, CMT