
Nurix Therapeutics, Inc. is a biopharmaceutical company. It focuses on the discovery, development and commercialization of oral, small molecule therapies designed to modulate cellular protein levels as a novel treatment approach for cancer and immune disorders.
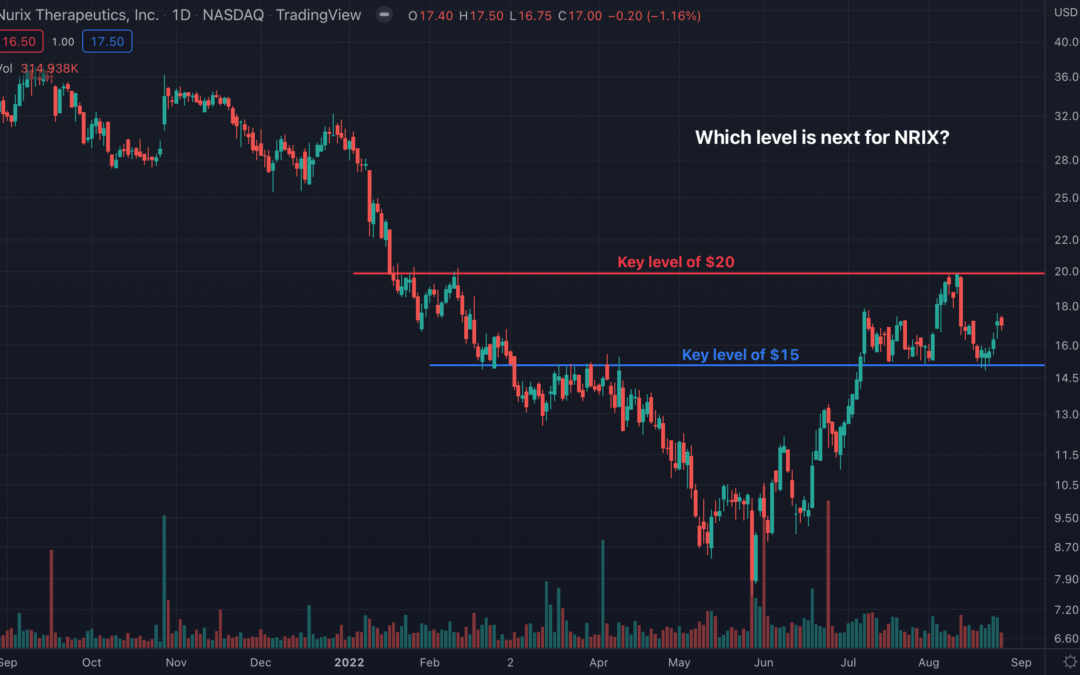
Take a look at the 1-year chart of Nurix (NASDAQ: NRIX) below with the added notations:
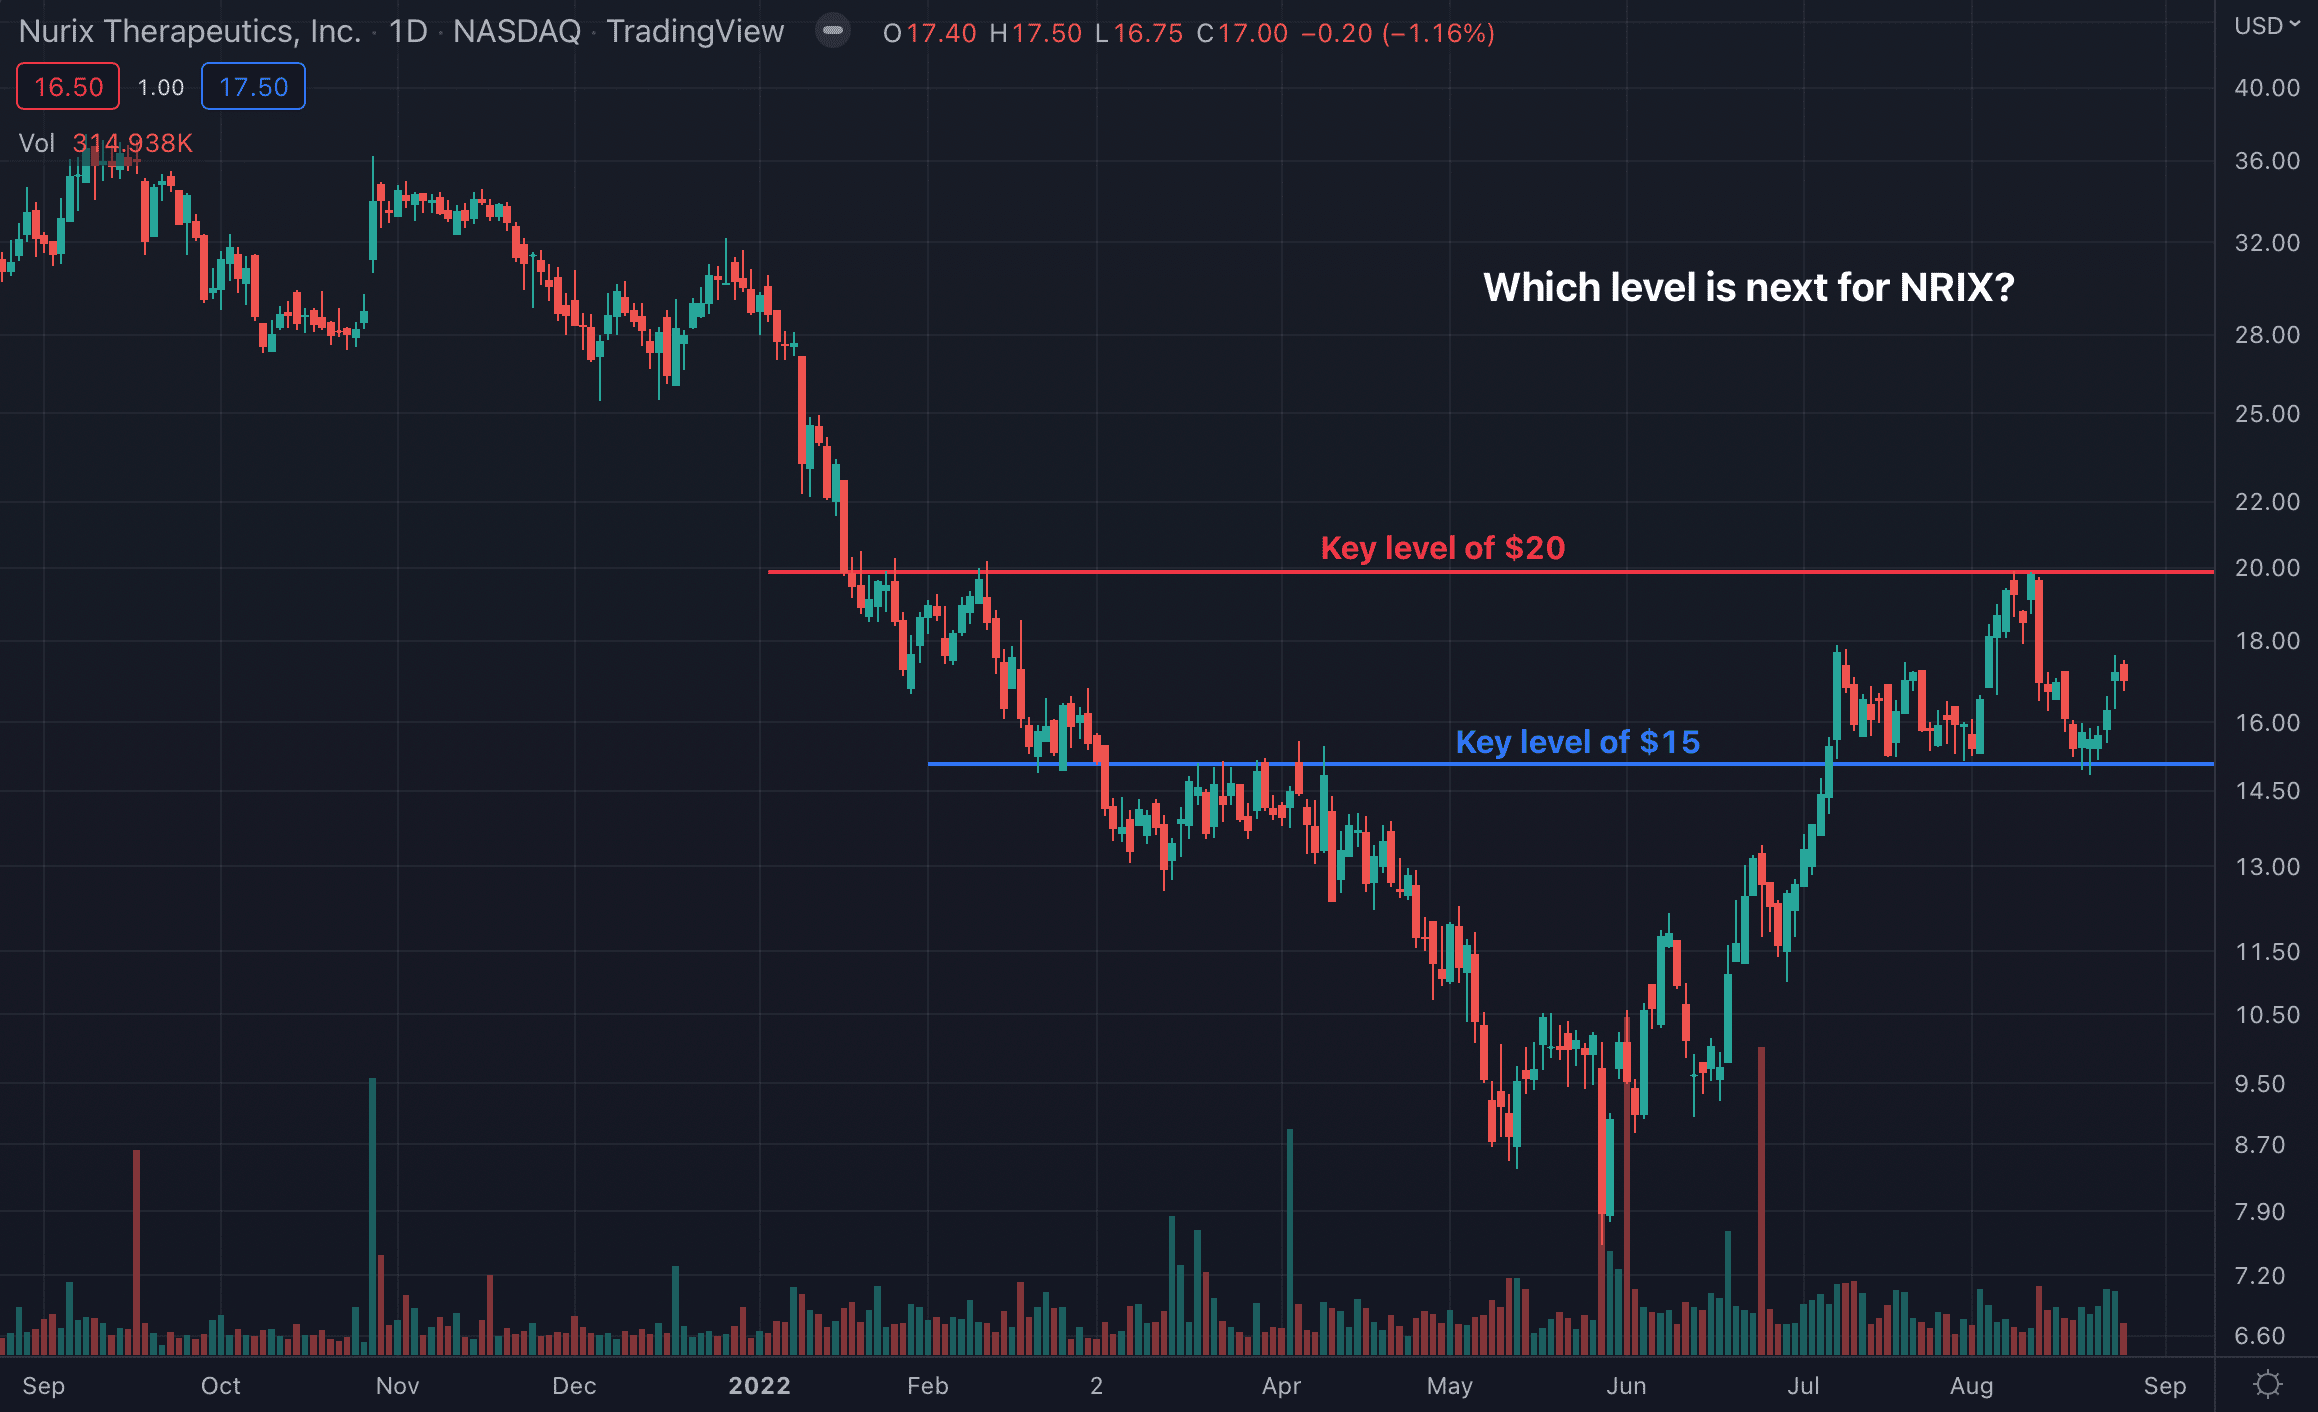 Chart of NRIX provided by TradingView
During the past six months, NRIX has formed two important levels worth keeping an eye on. The first is the $15 mark (blue), which has been both support and resistance for the stock on multiple occasions. The other level to watch is the $20 (red) mark. At some point, NRIX will approach and break one of those levels.
The Tale of the Tape: NRIX has key levels at $15 and $20. A trader could enter a long position on a break above $20 or on a pullback to $15. Short trades could be placed at $20, or on a break below $15. Either way, protective stops are advisable.
Before making any trading decision, decide which side of the trade you believe gives you the highest probability of success. Do you prefer the short side of the market, long side, or do you want to be in the market at all? If you haven’t thought about it, review the overall indices themselves. For example, take a look at the S&P 500. Is it trending higher or lower? Has it recently broken through a key resistance or support level? Making these decisions ahead of time will help you decide which side of the trade you believe gives you the best opportunities.
No matter what your strategy or when you decide to enter, always remember to use protective stops and you’ll be around for the next trade. Capital preservation is always key…
Good luck!
Christian Tharp, CMT