
Deere & Co. engages in the manufacture and distribution of equipment used in agriculture, construction, forestry and turf care. It operates through the following segments: Agriculture and Turf, Construction and Forestry and Financial Services.
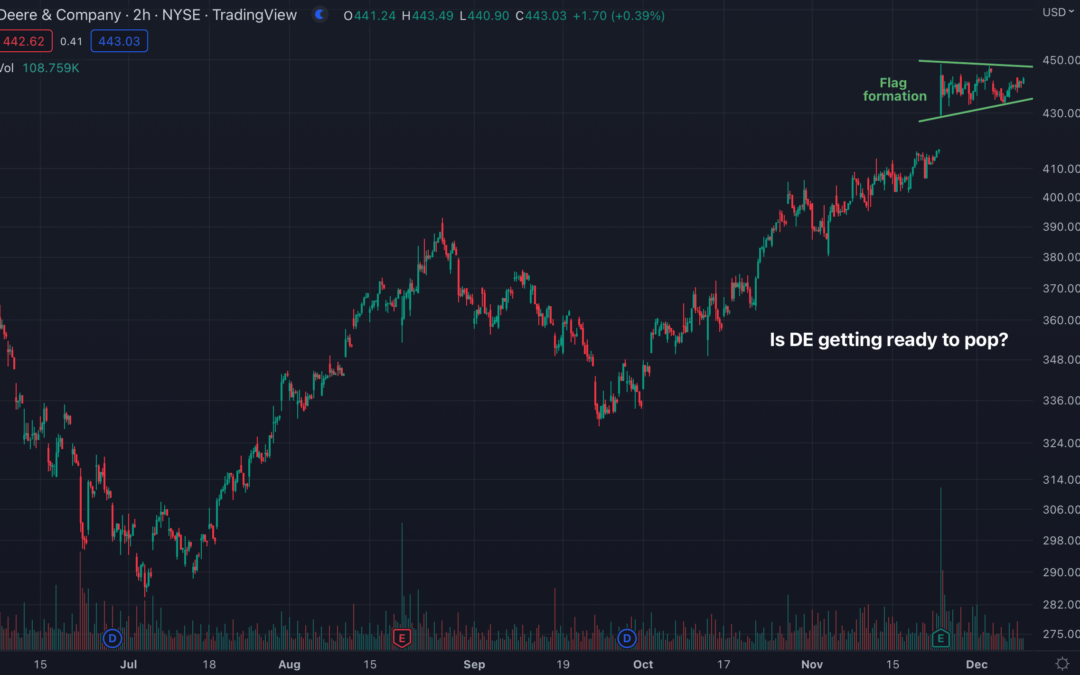
Take a look at the 6-month chart of Deere (DE) below with the added notations:
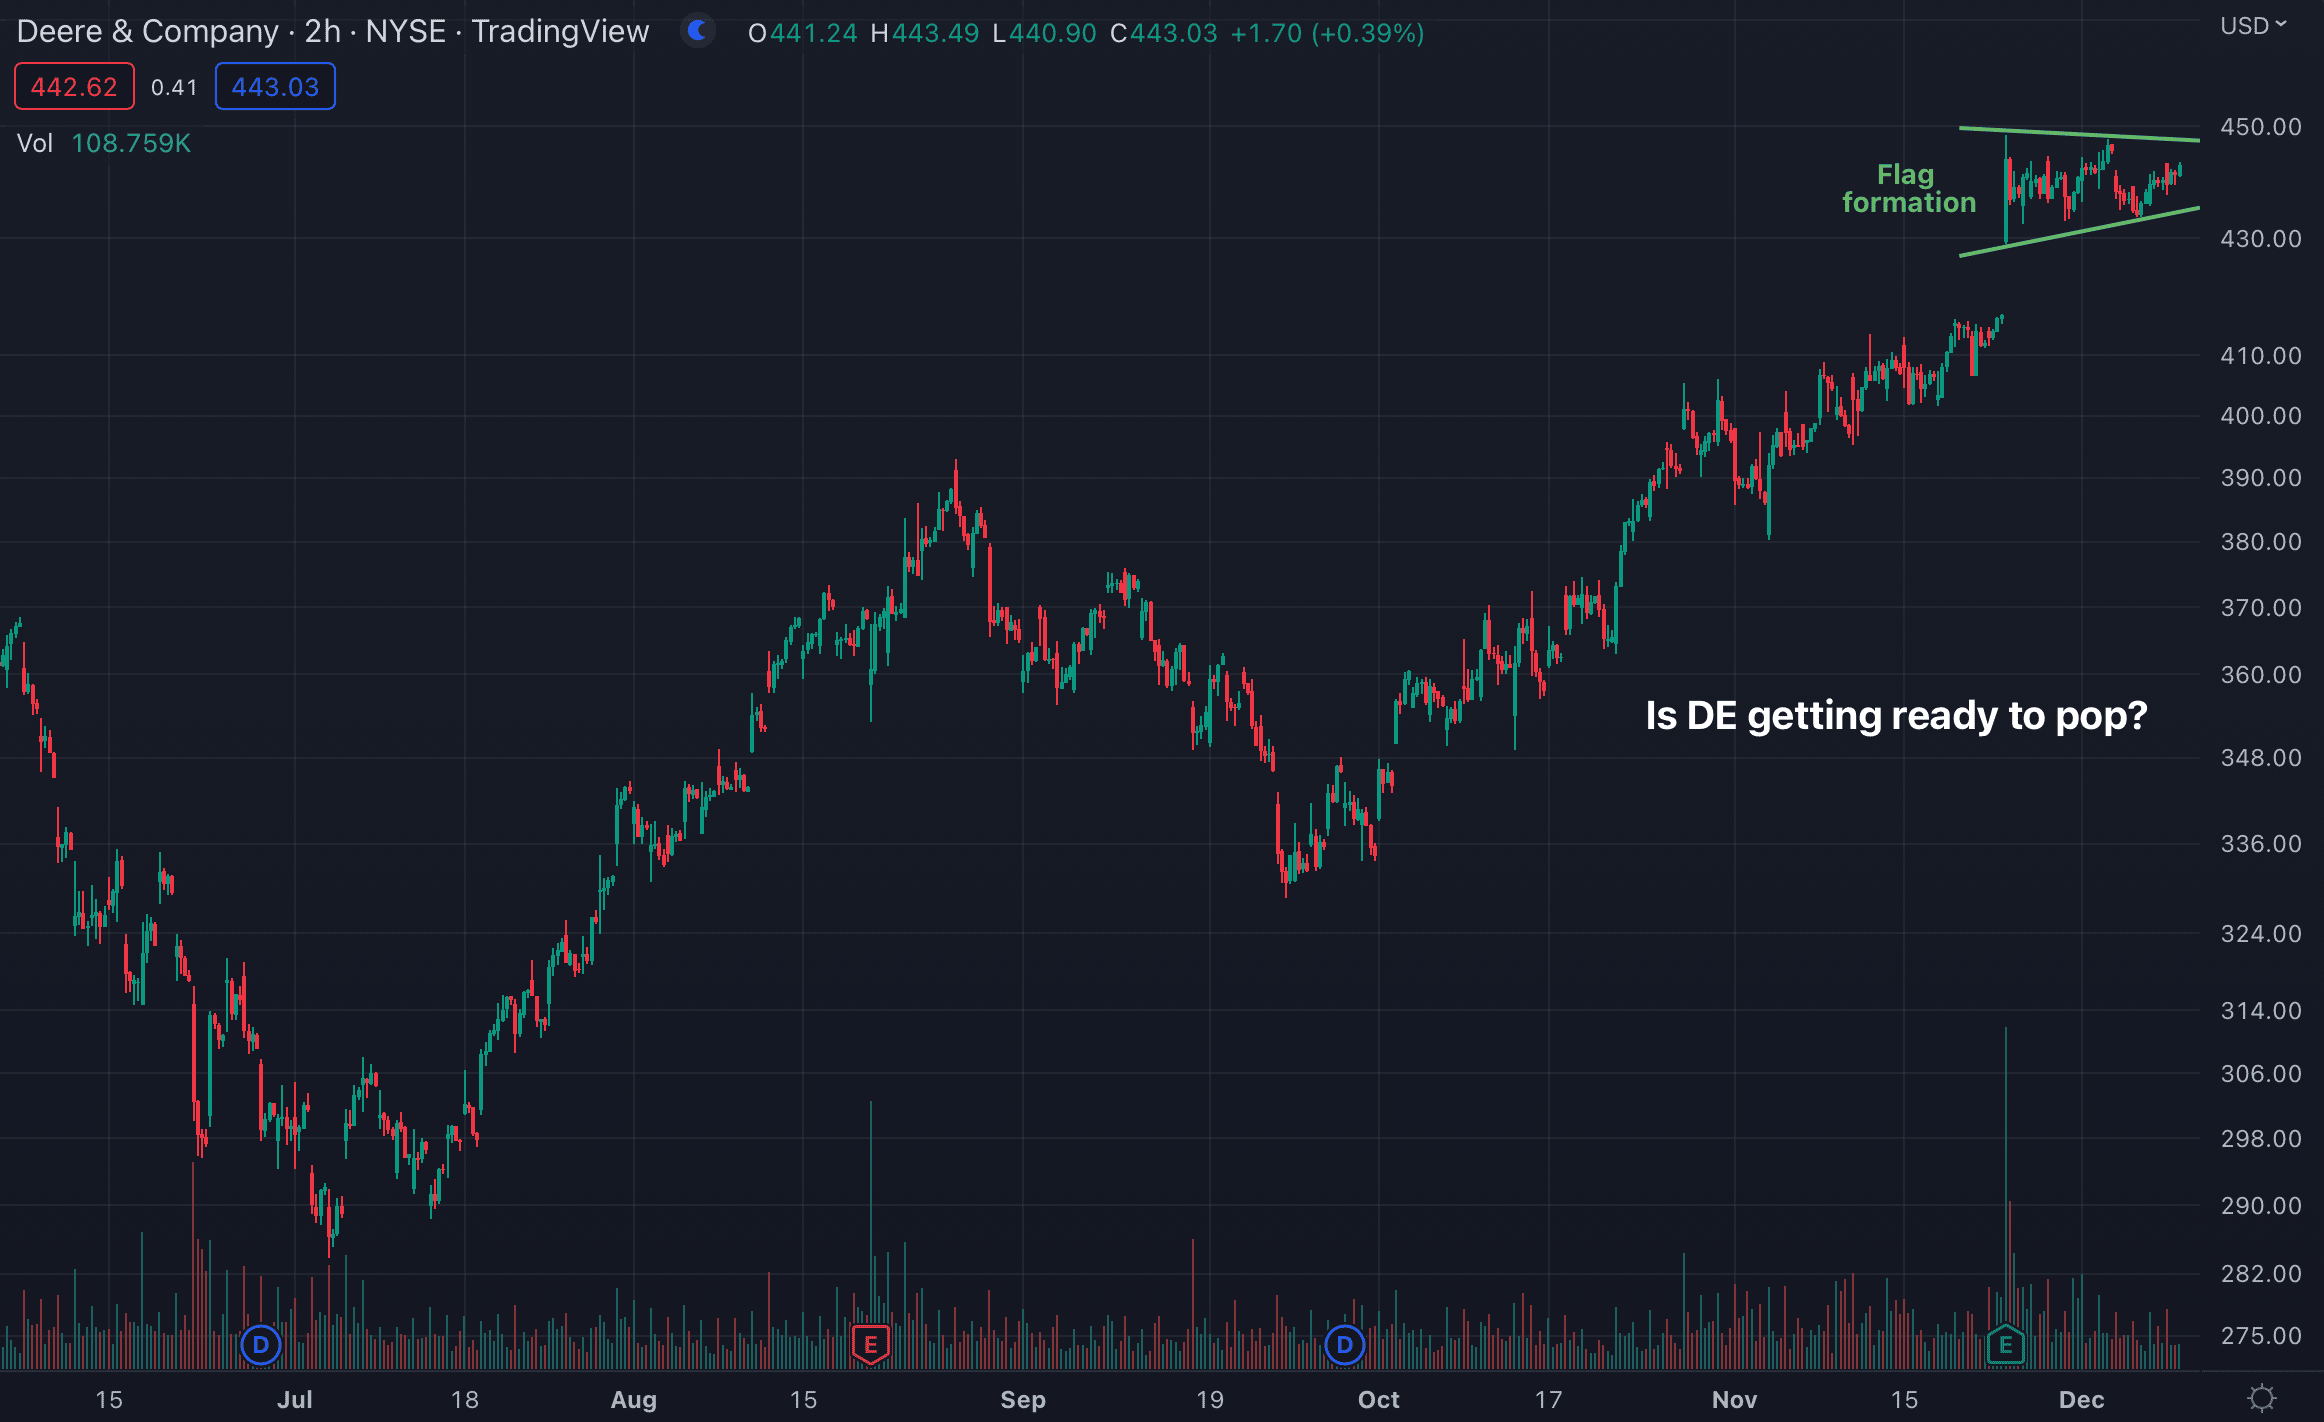
Chart of DE provided by TradingView
DE has been on a steep rally since the end of September and now seems to be consolidating within a bullish flag, or pennant, pattern (green). The flag’s trendline resistance and support can be seen on the chart above. A break through the topside of the flag should mean a run to several new highs.
The Tale of the Tape: DE is consolidating within a bullish pattern. A break above $450 area should lead to much higher prices, thus a long trade could be made.
Before making any trading decision, decide which side of the trade you believe gives you the highest probability of success. Do you prefer the short side of the market, long side, or do you want to be in the market at all? If you haven’t thought about it, review the overall indices themselves. For example, take a look at the S&P 500. Is it trending higher or lower? Has it recently broken through a key resistance or support level? Making these decisions ahead of time will help you decide which side of the trade you believe gives you the best opportunities.
No matter what your strategy or when you decide to enter, always remember to use protective stops and you’ll be around for the next trade. Capital preservation is always key…
Good luck!
Christian Tharp, CMT
ATTENTION SUBSCRIBERS!
Do not trade options until you watch my urgent message:
How to Use This Simple, Yet Extremely Powerful System to Find Substantial Gains With Options…