
Stratasys Ltd. engages in the provision of applied additive technology solutions for industries including aerospace, automotive, healthcare, consumer products, and education. Its systems include desktop 3D printers for idea and design development, various systems for rapid prototyping and large production systems for direct digital manufacturing.
Take a look at the 1-year chart of Stratasys (NASDAQ: SSYS) below with added notations:
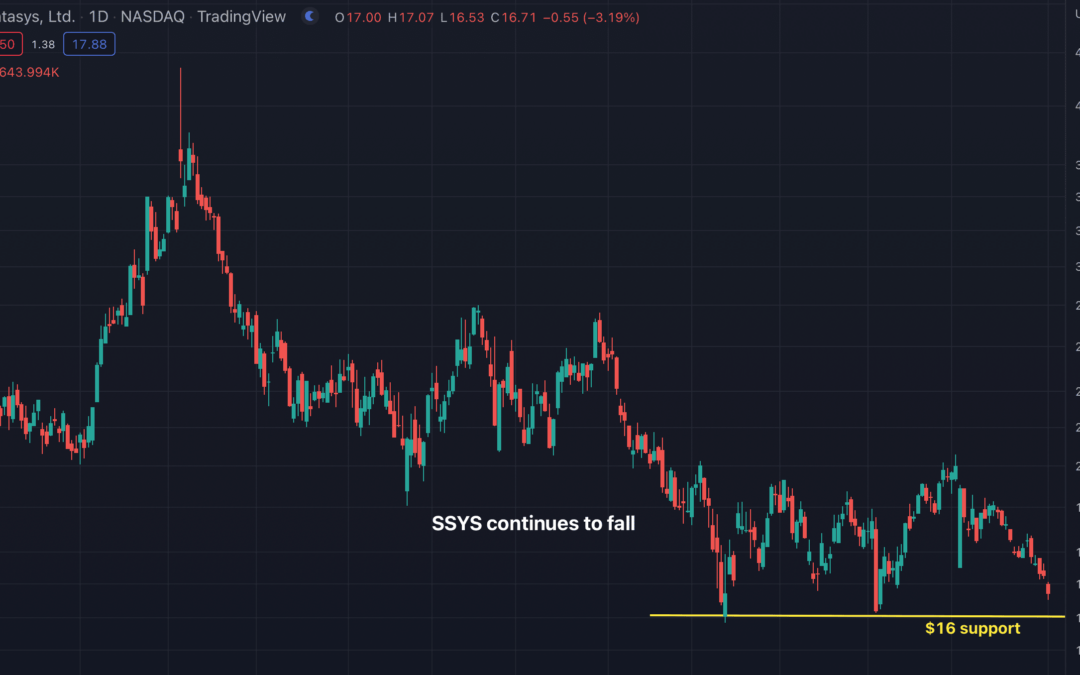
 Chart of SSYS provided by TradingView
SSYS has formed an important level of support around the $16 mark (yellow). The stock has rallied off that mark twice already and now appears to be declining back down to it again. Even though the stock may get another bounce off that support, if the $16 level were to break instead, much lower prices might follow for SSYS.
The Tale of the Tape: SSYS has a key support area around $16. A trader could enter a long position at or around the mark with a stop placed under it. If the stock were to break below the support, a short position could be entered instead.
Before making any trading decision, decide which side of the trade you believe gives you the highest probability of success. Do you prefer the short side of the market, long side, or do you want to be in the market at all? If you haven’t thought about it, review the overall indices themselves. For example, take a look at the S&P 500. Is it trending higher or lower? Has it recently broken through a key resistance or support level? Making these decisions ahead of time will help you decide which side of the trade you believe gives you the best opportunities.
No matter what your strategy or when you decide to enter, always remember to use protective stops and you’ll be around for the next trade. Capital preservation is always key…
Good luck!
Christian Tharp, CMT